Spring 2022 Consumer Trends for Restaurants
Data driven decisions yield results. It’s why our suite of software and services are built around driving actionable insights from customer and...
1 min read
Olivia McEwen
March 26, 2024

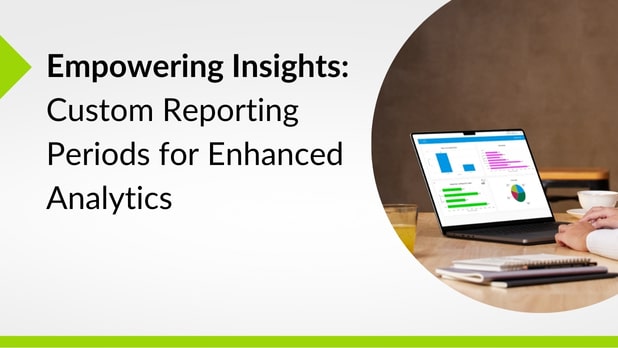
We're excited to announce a significant enhancement to our reporting capabilities based on valuable customer feedback. Over the past few months, our team has been hard at work delivering a highly-requested feature: the ability for organizations to create and utilize custom reporting periods.
The configuration of “custom reporting periods” empowers users to synchronize reporting in the Intouch platform with their specific business cycles and requirements.
For example, this enhancement will enable users to easily report on:
This customization ensures data is represented in a way that increases the relevancy for the users and ensures that all users see their data using consistent periods when evaluating performance, resulting in better data-driven decision-making.
This feature enhancement is designed to give users more flexibility to control reporting timeframes outside the standard reporting timelines. Standard reporting timelines are synced to calendar configuration like, this month/this quarter/ this year, or last 30 days/last 90 days/last year.
When users have a requirement to report their data in non-calendar configurations, this enhancement will make it easy to surface data from these custom periods, and compare these custom periods over time.
Step 1: Set up your preset custom reporting periods:
Admin users can now create, edit, and group preset custom reporting periods. These periods, customizable per organization, offer versatile reporting setups, with users able to select any start-to-end date for precise analyses.
Step 2: Configure your charts and custom record lists
Once the custom reporting periods are set up, you can then use them when creating charts and lists in Custom Reporting. This feature allows users to visualize data within specific timeframes and compare different reporting periods seamlessly. Additionally, users can view charts and tables with the current reporting period and easily add preceding periods for comprehensive analysis.
Discover further insights on custom reporting periods by joining our Product Update Webinar on Thursday, April 18th.

Data driven decisions yield results. It’s why our suite of software and services are built around driving actionable insights from customer and...

With compounding external factors such as supply chain issues, labor shortages, and rising inflation impacting the daily operations of convenience...

Fall is finally here! As the weather cools down and retailers ramp up for the holidays, let us be the Goose – no, not the Christmas kind – to your...